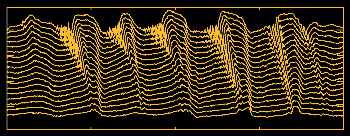


Often, data change as a function of time, or as a function of another parameter. For example, the line plot shown in the Analysis Tool window originates from a larger data set that evolves over time, as shown above. A "stack plot" is a simple way of displaying this information. Because all time slices are shown simultaneously, characteristic features in the data can be compared time-step to time-step, at one glance.Back