
|
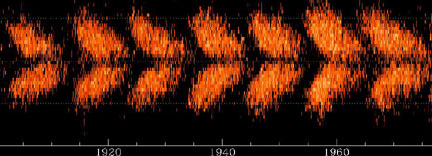
The construction of sunspot butterfly diagrams was first carried out by E.W. Maunder in 1904, and proceeds as follows:
These observations include information on the sizes and positions of sunspots as well as their numbers. This data shows that sunspots are not randomly distributed over the surface of the sun, but are concentrated in two latitude bands on either side of the equator. |
|
| [BACK] | [OVERVIEW] |